Sometimes we want to visualise data, in the form of infographic or chart/dashboard. For example, this is interactive chart depicting salaries growth rate:
This could be used in media articles as well to back content with (live) data.
Infogram tool
We use infogram tool for data visualisation as it allows to share charts easily and have quite big collection of charts available.
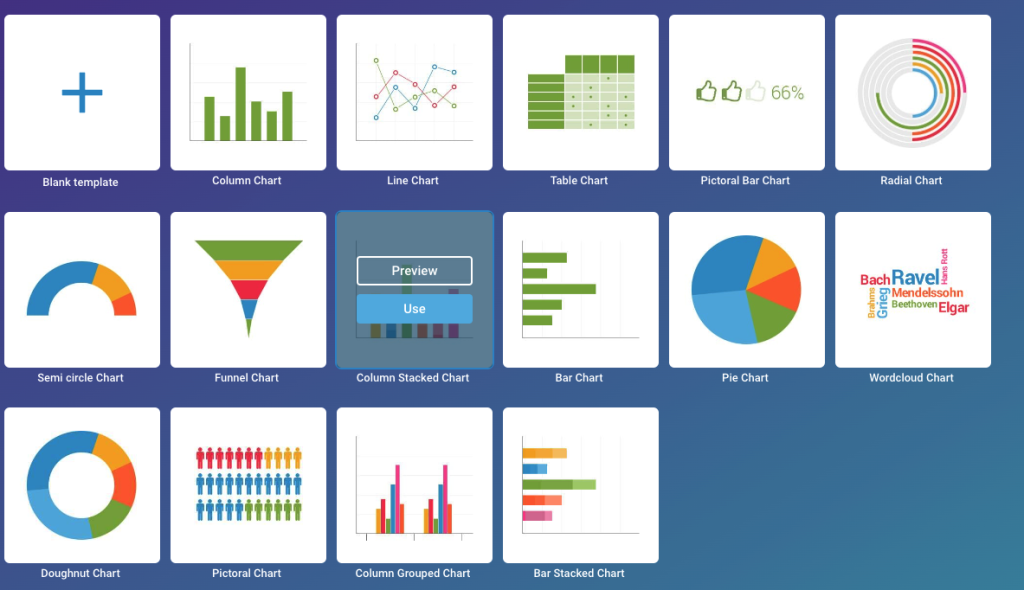
Example: line chart
We will use example above (charts) to demonstrate how to build interactive chart.
Lets build static chart first. Pick line chart, and add data manually:
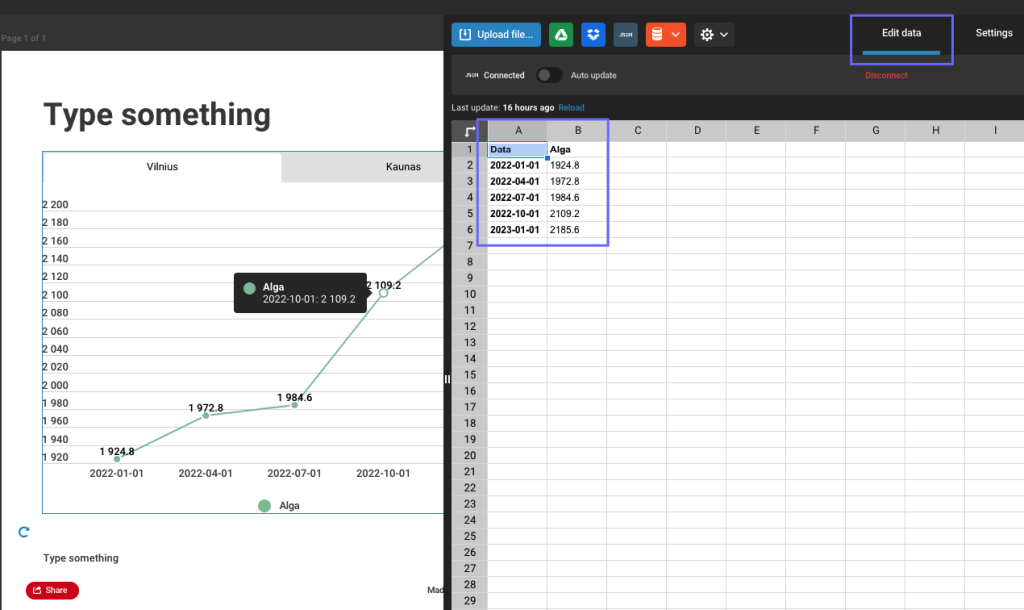
To keep it interactive you will need to use JSON feeds option.
Important: works for static snapshot, for live updates (i.e. update real time) it requires paid version of app.
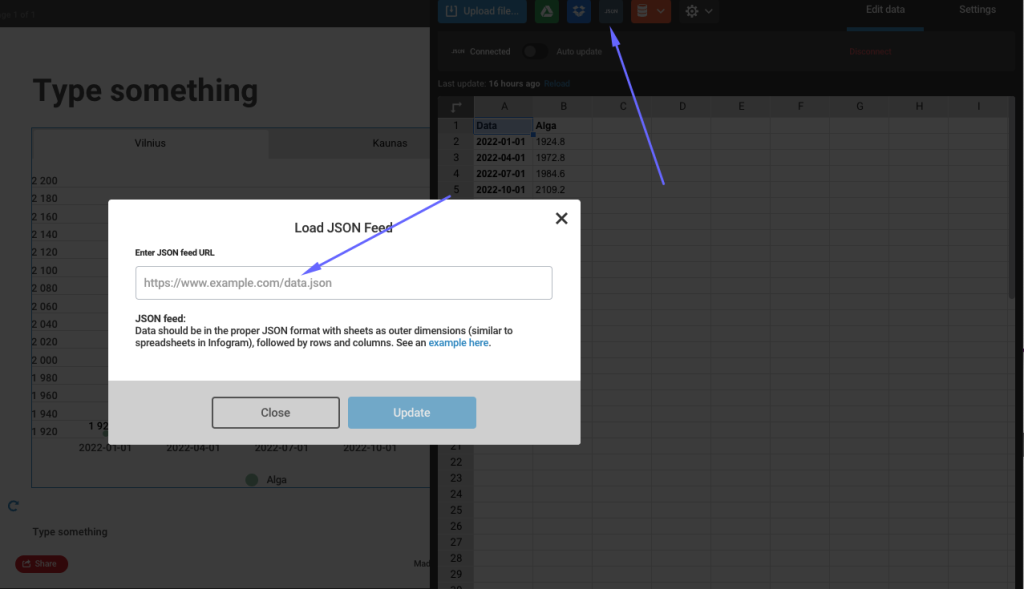
Data should be in the proper JSON format with sheets as outer dimensions (similar to spreadsheets in Infogram), followed by rows and columns.
[[["Index of Happiness","09:00","10:00","11:00","12:00","13:00"],["Eden",794,404,301,563,406],["Shambhala",470,940,142,575,294],["Avalon",332,914,860,616,741],["Camelot",351,686,720,447,467],["El Dorado",863,353,612,872,533],["Atlantis",382,882,240,320,420]]]Here is the API link which returns JUST data, without other meta information (snapshot created date, etc). You will have to use this in Infogram tool when prompted “Enter JSON feed URL” (replace challenge with your ID):
https://api.dataplatform.lt/snapshots/latest/json/?challenge_id=459You can inspect results here. Here is example which would produce data in required format in data platform
import requests
import json


def get_last_snapshot(challenge_id):
  api_url = 'https://data-platform-backend-4ddpl.ondigitalocean.app/snapshots/latest/?challenge_id=%d' % challenge_id
  response = requests.get(api_url)
  data = response.json()
  return data.get('json_data', [])

payroll_data = get_last_snapshot(237)

location = 'Vilnius'
payroll_data = list(filter(lambda p: p.get('location') == location and p.get('salary') == 'Bruto' and p.get('company_status') == 'With', payroll_data))
payroll_data.sort(key=lambda d: d.get('date'))

results = []
results.append(['Data', 'Alga'])
for item in payroll_data:
  results.append([item.get('date'), item.get('value')])

combined_results = [results]
print(json.dumps(combined_results))