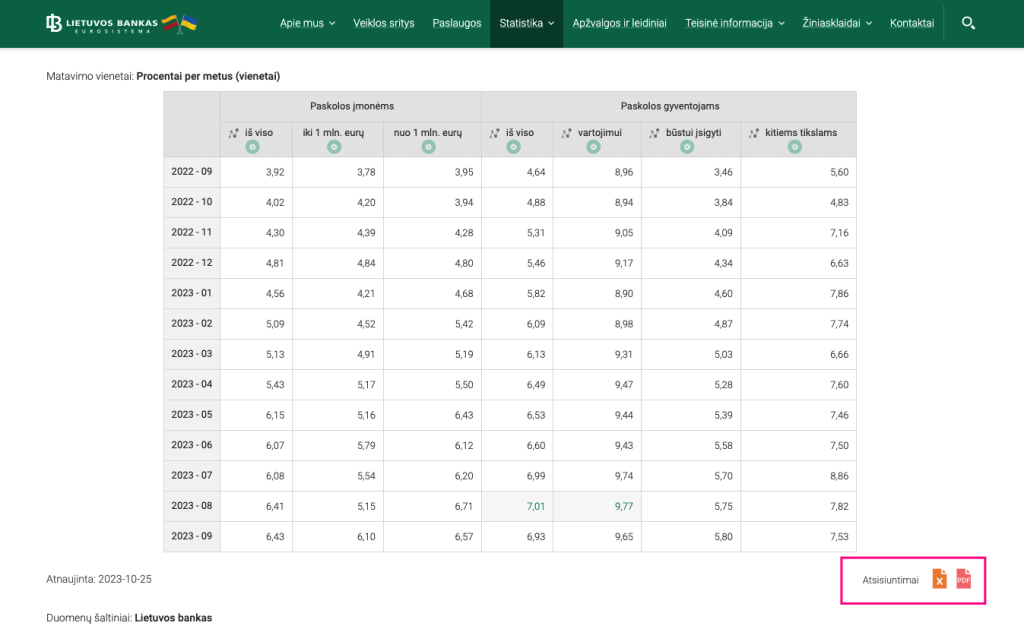
Example: Borrowing rates at Lithuanian Bank is provided as statistics page. It has data structured as table, but it is always recommended to use structured data, in this case download as XLS.
The best strategy to fetch data is to use Python pandas library, as it has quite advanced XLS reading capabilities. Here is example how to read structured data for this example:
Sometimes we want to visualise data, in the form of infographic or chart/dashboard. For example, this is interactive chart depicting salaries growth rate:
This could be used in media articles as well to back content with (live) data.
Infogram tool
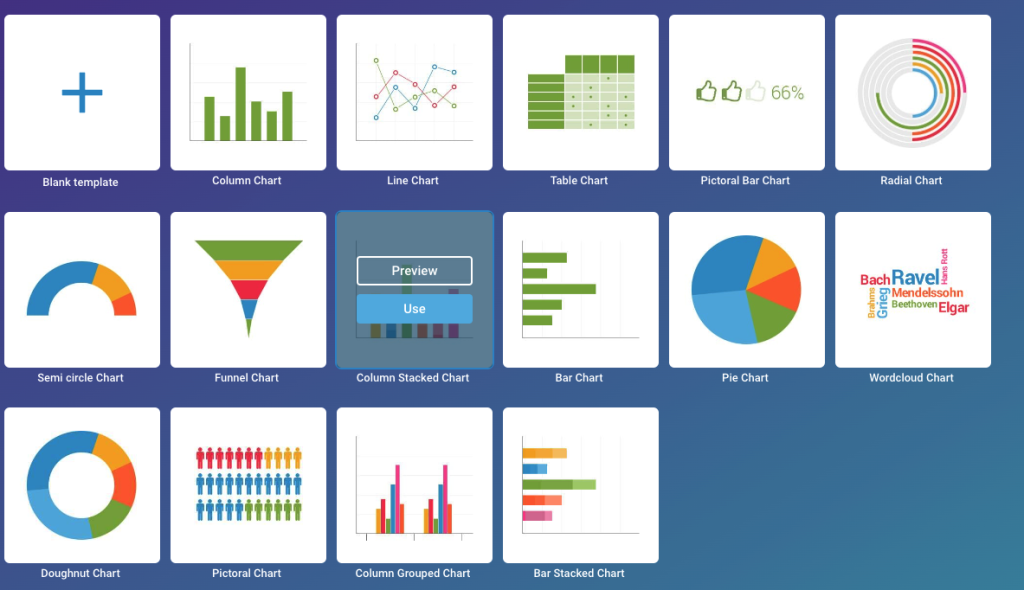
We use infogram tool for data visualisation as it allows to share charts easily and have quite big collection of charts available.
Example: line chart
We will use example above (charts) to demonstrate how to build interactive chart.
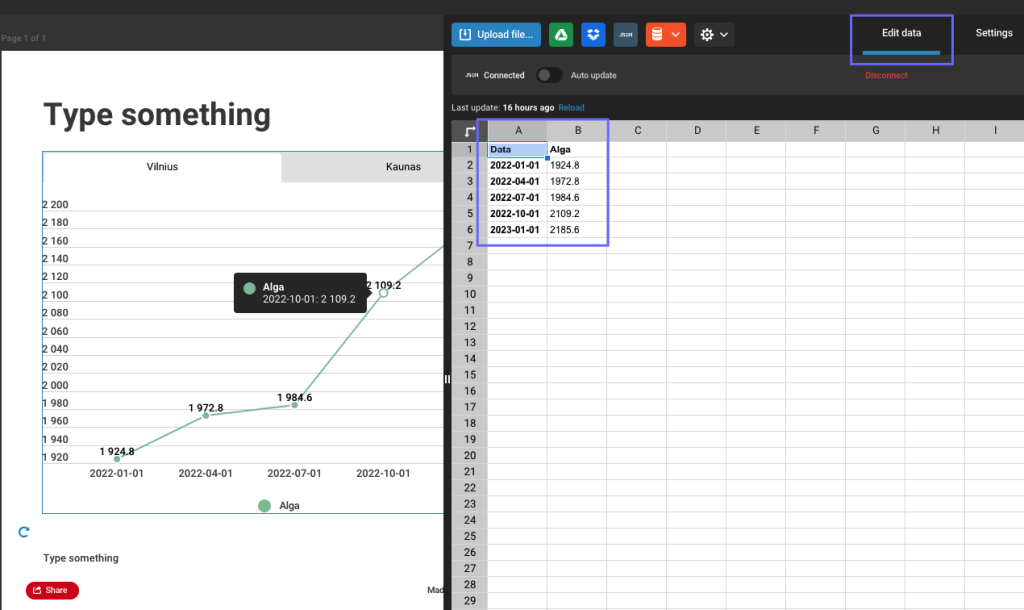
Lets build static chart first. Pick line chart, and add data manually:
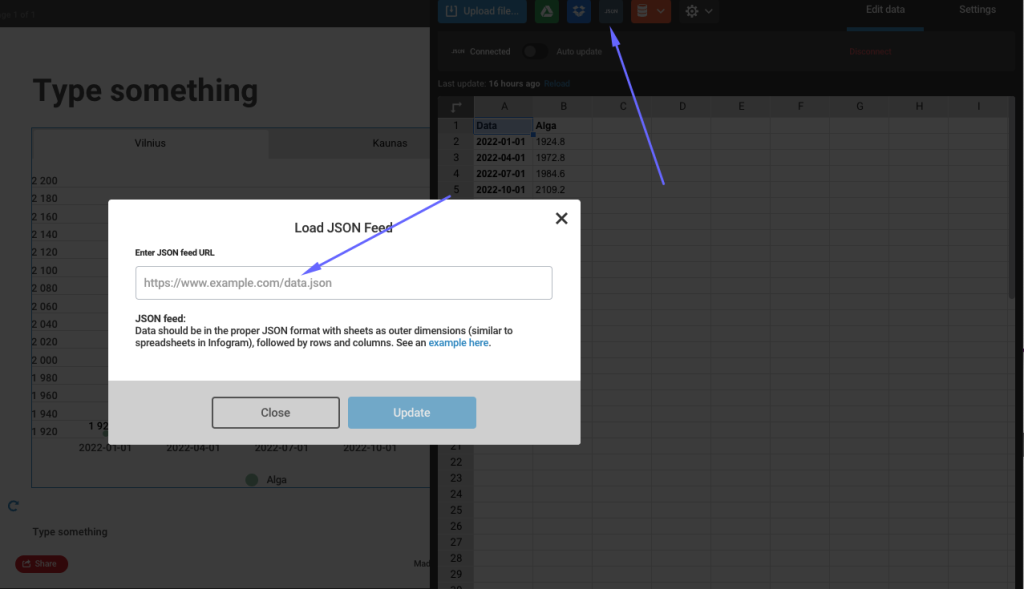
To keep it interactive you will need to use JSON feeds option.
Important: works for static snapshot, for live updates (i.e. update real time) it requires paid version of app.
Data should be in the proper JSON format with sheets as outer dimensions (similar to spreadsheets in Infogram), followed by rows and columns.
[[["Index of Happiness","09:00","10:00","11:00","12:00","13:00"],["Eden",794,404,301,563,406],["Shambhala",470,940,142,575,294],["Avalon",332,914,860,616,741],["Camelot",351,686,720,447,467],["El Dorado",863,353,612,872,533],["Atlantis",382,882,240,320,420]]]
Here is the API link which returns JUST data, without other meta information (snapshot created date, etc). You will have to use this in Infogram tool when prompted “Enter JSON feed URL” (replace challenge with your ID):
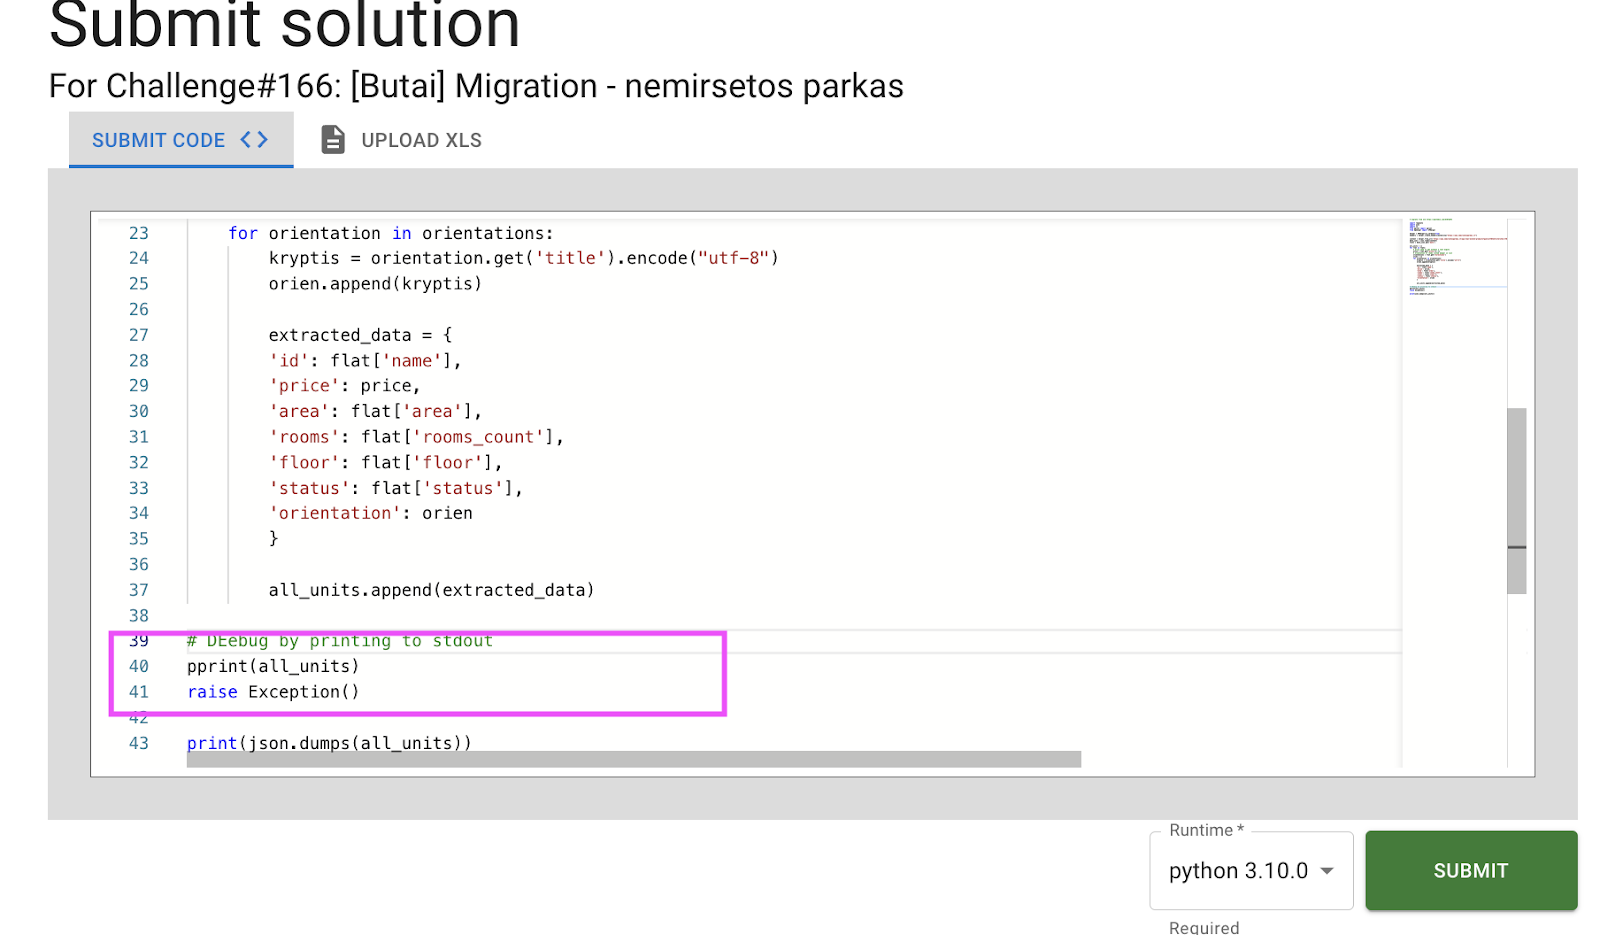
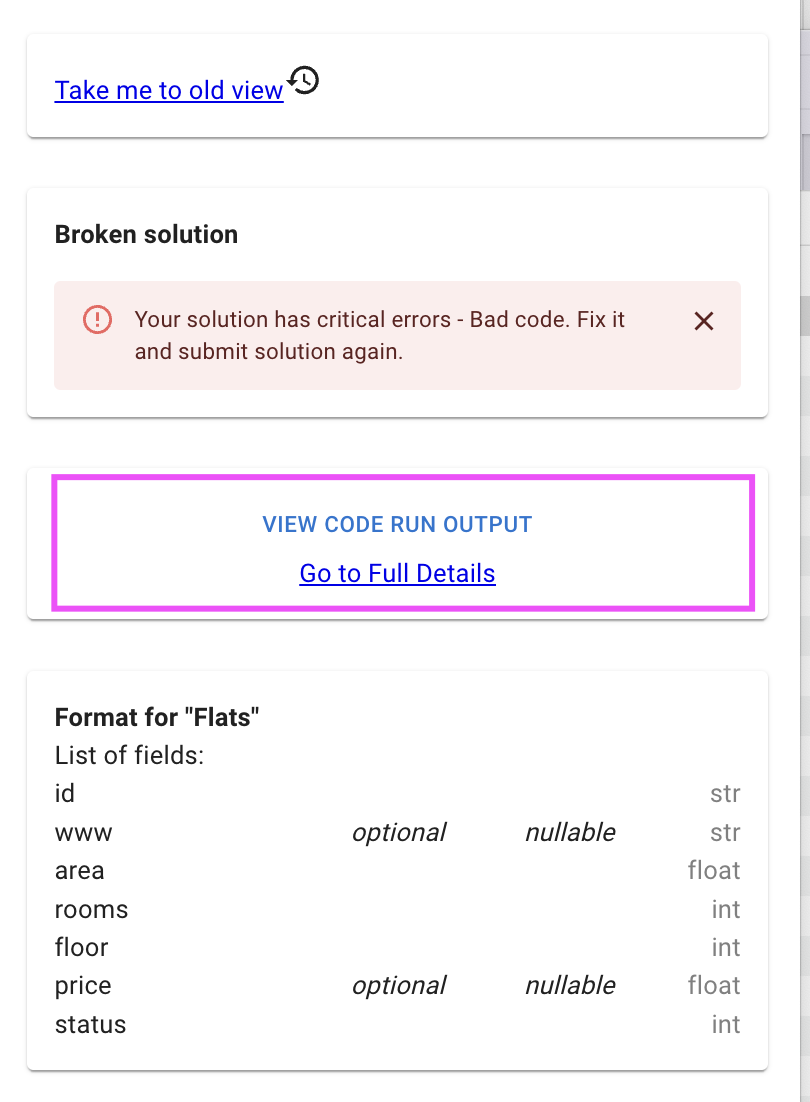
Lost why your pipeline breaks? Add print statement (typically combining with existing program immediately, for example by throwing exception):
Now check intermediate print results shown in output
Another approach to debug is simply use stderr to print intermediate debug output. The pattern is as following:
import sys
print('This is an error message', file=sys.stderr)

# Output:
# This is an error message
Tip: data platform will only read sys.stdout as an output. You can use this as afeature: if you need to have some print statements (for example, statistics of each step in pipeline), you can route them to stderr.
For use cases like listing portals, e-commerce (eshops), typical pattern is having very many pages in the system. Write one pipeline which crawls entire website and produces urls, while other populates data using those urls.
In a lot of cases even in indexing stage, you can find most of required information, so it would be faster. Furthermore, this will require less load on target website and decrease chance of being blocked.
Tip: please refer to section how to reuse data from another pipeline in our plaform.
In case you need to normalize data, write multiple pipelines: first, the one which scrapes original data unformatted. Then write extra pipeline which normalizes data from previous pipeline.
This way you can always fix problems ar adjust normalization for older datasets (no data is lost)
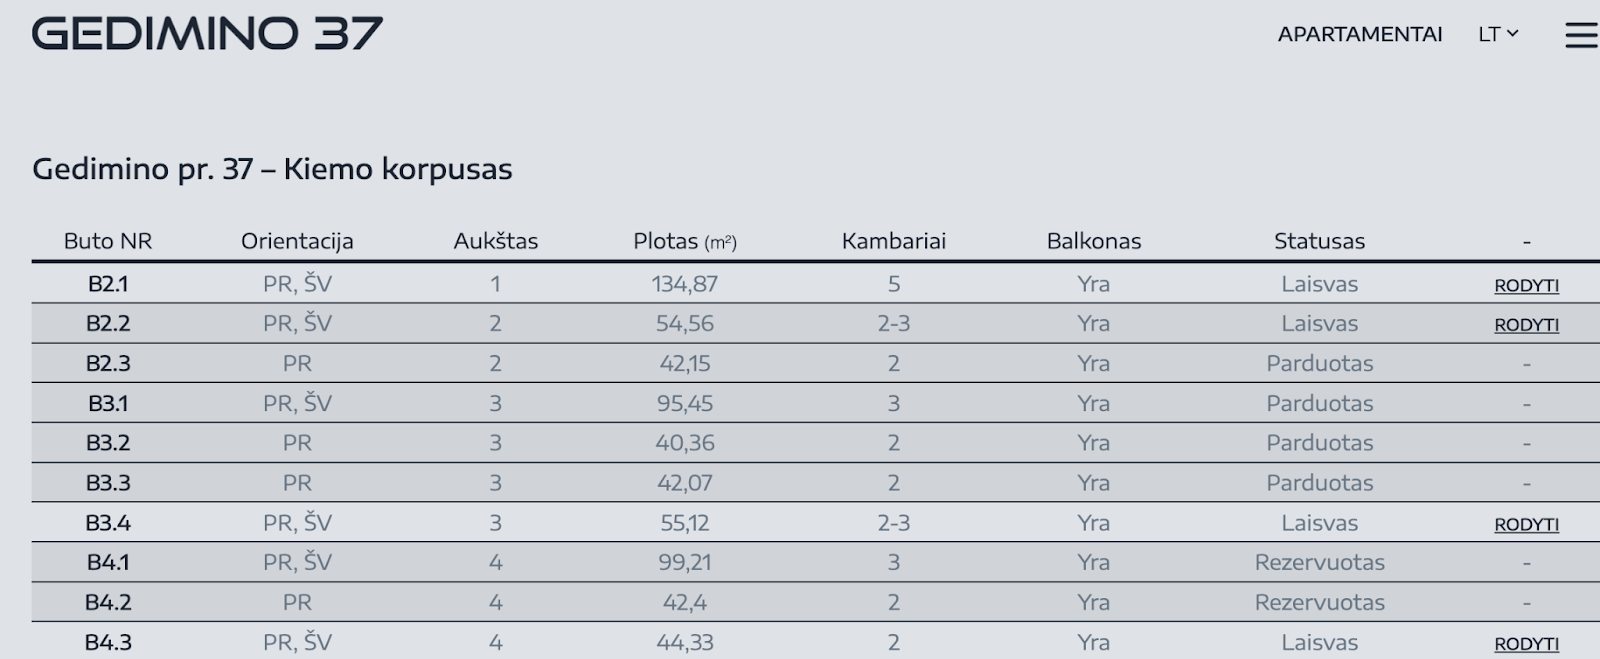
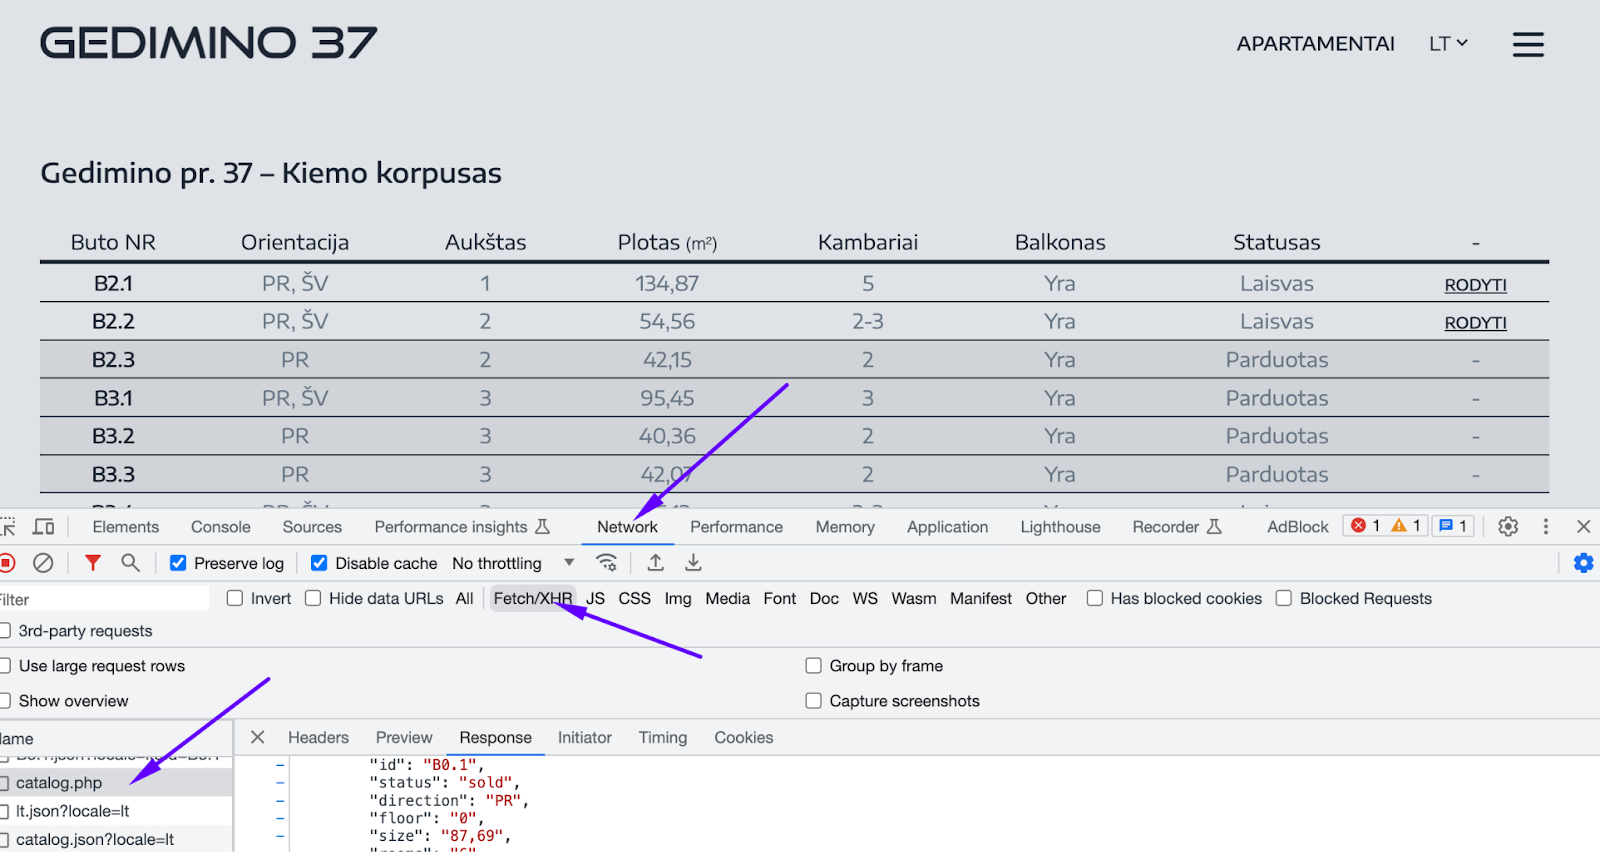
Sometimes data for web page is loaded dynamically, i.e. on demand. This can be done for performance reasons, to make initial load faster. Sometimes you can identify this pattern by observing spinners or loaders, or content appearing incrementally:
On the browser, this can be observed by inspecting Network tab of debugger tools. For example, on Chrome, you can find Network tab by clicking on menu “View > Developer > Developer Tools” and going into Network tab