Image service
This is description how to use our internal image service. First you need to initialize wit api_key which is stored on Dataplatform backend associated with user. Note that we don’t have have UEX yet to create/show/find it.
dphelper = DPHelper(api_key='ADD_YOUR_KEY_TO_TEST')After authorizing with DPHelper, you can now use image service. To upload single image:
dphelper.upload_image_from_url('https://www.google.com/images/branding/googlelogo/2x/googlelogo_color_92x30dp.png')To upload multiple images by url
 dphelper = DPHelper(api_key='ADD_YOUR_KEY_TO_TEST')
   image_urls = [
     'https://google.com/image1.png',
     'https://google.com/image2.png',
    ]
    results = dphelper.upload_all_images(image_urls, max_concurrent=10)
Note: API is permissive, i.e. does not throw if some of the imags are already downloaded
Streaming JSON
Sometimes data stored in memory can become very large, for example the pattern of pagination here:
# ssva.lt energinio naudingumo registras

# from pprint import pprint
import re
import json
from dphelper import DPHelper

helper = DPHelper(is_verbose=True)
headers = helper.create_headers(authority='ssva.lt')

def generate_url(page_number, PAGE_SIZE=10000):
    return f'https://www.ssva.lt/registrai/pensreg/pensert_list.php?goto={page_number}&pagesize={PAGE_SIZE}'

PAGINATION_DATA_PATTERN = ('Toliau</a></li>.*?pageNum="(.*?)" >Pabaiga</a>')

DATA_PATTERN = (
    '<tr  id="gridRow.*?class="r-gridrow">'
    '<tddata-record-id=".*?".*?SertifikatoNr".*?val="(.*?)" >' # sert nr
    '.*?"IsdavimoD".*?val="(.*?)" >' # isdavimo data
    '.*?GaliojimoD".*?val="(.*?)" >' # galiojimo data
    '.*?UnikalusNr".*?val="(.*?)" >' # unikalus nr
    '.*?Adresas".*?val="(.*?)" >' # adresas
    '.*?Paskirtis.*?val="(.*?)" >' # paskirtis
    '.*?PEN".*?val="(.*?)" >' # PEN
    '.*?Ap" >.*?val="(.*?)" >' # sildomas plotas
    '.*?Q".*?val="(.*?)" >' # E.sanaudos
    '.*?Hsrc".*?val="(.*?)" >' # silumos saltinis
    '.*?Pastaba".*?val="(.*?)" ></span></span></td></tr>' # pastaba
)

def get_page_count():
    FIRST_PAGE_URL = generate_url(1)
    raw_content = helper.from_url(FIRST_PAGE_URL, headers=headers)
    rg = re.compile(PAGINATION_DATA_PATTERN)
    last_page_nr = rg.findall(raw_content)
    return int(last_page_nr[0])

if __name__ == "__main__":
    last_page_nr = get_page_count()
    # Compile is slow, so we do it once
    rg = re.compile(DATA_PATTERN)

    data = []
    for page_number in range(1, last_page_nr + 1):
        url_for_read = generate_url(page_number)
        # print(url_for_read)
        page_content = helper.from_url(url_for_read, headers=headers)
        results = rg.findall(page_content)
        data.extend(results)
        print(json.dumps(results, indent=2))

    print(json.dumps(data, indent=2))
In such scenarios it can be useful to define this as streamin g response from json_stream pip package. Basic example:
import sys
import json

from json_stream import streamable_list

def test_stream():
    for i in range(20):
        yield i


# wrap existing iterable
data = streamable_list(test_stream())

# consume iterable with standard json.dump()
json.dump(data, sys.stdout)
Applying example to this scenario:
# ssva.lt energinio naudingumo registras

# from pprint import pprint
import re
import json
import sys
from dphelper import DPHelper


from json_stream import streamable_list

helper = DPHelper(is_verbose=True)
headers = helper.create_headers(authority='ssva.lt')

def generate_url(page_number, PAGE_SIZE=100):
    return f'https://www.ssva.lt/registrai/pensreg/pensert_list.php?goto={page_number}&pagesize={PAGE_SIZE}'

PAGINATION_DATA_PATTERN = ('Toliau</a></li>.*?pageNum="(.*?)" >Pabaiga</a>')

DATA_PATTERN = (
    '<tr  id="gridRow.*?class="r-gridrow">'
    '<tddata-record-id=".*?".*?SertifikatoNr".*?val="(.*?)" >' # sert nr
    '.*?"IsdavimoD".*?val="(.*?)" >' # isdavimo data
    '.*?GaliojimoD".*?val="(.*?)" >' # galiojimo data
    '.*?UnikalusNr".*?val="(.*?)" >' # unikalus nr
    '.*?Adresas".*?val="(.*?)" >' # adresas
    '.*?Paskirtis.*?val="(.*?)" >' # paskirtis
    '.*?PEN".*?val="(.*?)" >' # PEN
    '.*?Ap" >.*?val="(.*?)" >' # sildomas plotas
    '.*?Q".*?val="(.*?)" >' # E.sanaudos
    '.*?Hsrc".*?val="(.*?)" >' # silumos saltinis
    '.*?Pastaba".*?val="(.*?)" ></span></span></td></tr>' # pastaba
)

def get_page_count():
    FIRST_PAGE_URL = generate_url(1)
    raw_content = helper.from_url(FIRST_PAGE_URL, headers=headers)
    rg = re.compile(PAGINATION_DATA_PATTERN)
    last_page_nr = rg.findall(raw_content)
    return int(last_page_nr[0])

def yield_data():
    last_page_nr = get_page_count()
    rg = re.compile(DATA_PATTERN)

    last_page_nr = 5

    for page_number in range(1, last_page_nr + 1):
        url_for_read = generate_url(page_number)
        page_content = helper.from_url(url_for_read, headers=headers)
        results = rg.findall(page_content)

        for result in results:
            yield result


if __name__ == "__main__":
    # wrap existing iterable
    data = streamable_list(yield_data())

    # consume iterable with standard json.dump()
    json.dump(data, sys.stdout)
Enforcing data freshness
Sometimes we reuse output from other pipelines using this pattern:
helper = DPHelper(is_verbose=True)
r = helper.snapshot.get_latest(by_challenge_id=140)
We do have staleness checks on the pipelines. However, if pipeline reuses other pipeline data the pattern above would silently fail.
To avoid that situation, since dphelper v0.16 version we added optional parameter max_stale_days.
First, make sure you update your pip package localy.
pip3 install dphelper -UCheck your package version
pip show dphelperIf everything OK, then use this pattern
helper = DPHelper(is_verbose=True)
r = helper.snapshot.get_latest(by_challenge_id=140, max_stale_days=14) Geocoding
DPHelper allows to convert address to coordinates (lat, lng) or reverse. However this is gated feature. If you need this, ask your coordinator for API key.
Usage pattern
from dphelper import DPHelper

helper = DPHelper(api_key='XXX', geo_provider='mixed')
print(helper.geocode(location='Vilnius', is_reverse=False))
print(helper.get_coords("Didlaukio g. 59, Vilnius")
Geo Provider
- rc – cheap, strict format, good for LT big cities; yet shall be used at risk of getting no coords;
- google – moderate cost, loose format, handles worldwide addresses;
- mixed – cheap + safe because uses rc where applicable, else uses google;
- any – uses “google”
“rc” Supported examples:
Vilniaus g. 1, Vilnius
žvejų g . 1 Lazdijai
Didlaukio g. 59, 08302 Vilnius, Lithuania
Genio g. 59A-1012 Vilnius, Lithuania
.,,,,,.Lazdijai žvejų g 1 lt67120 lietuva.  .
Vilnius genio gatvė 9
Vilnius genio skveras 9,
genio a. 9 Žemaičių kalvarija LT
Vilnius, Didlaukio g. 59
Kudirkos Naumiestis Dariaus ir Girėno g. 1 Lietuva
Lazdijai žvejų g.1
Lazdijai m. k. čiurlionio g. 9
m. k. čiurlionio g. 9 Lazdijai
M. K. Čiurlionio g. 9, Lazdijai, 67104 Lazdijų r. sav.
Vilniaus g. 17, Parudaminys, Vilniaus raj.
Vilniaus g. 17, Parudaminys, Vilniaus rajonas
Vilniaus g. 17, Parudaminio k., Vilniaus raj.
Unsupported examples:
Martinavos k., Martinavos g. 8
Kauno g. 1, Šilagalio k.
Garnio g. 32, Gineitiškių k.
Parudaminio k. Vilniaus raj. Vilniaus g. 17
lt67120Protected: Statistikos departamento duomenys
Reading XLS files
Reading structured data from XLS format
Sometimes data is provided as the XLS file.
Example: Borrowing rates at Lithuanian Bank is provided as statistics page. It
has data structured as table, but it is always recommended to use structured data, in this case download as XLS.
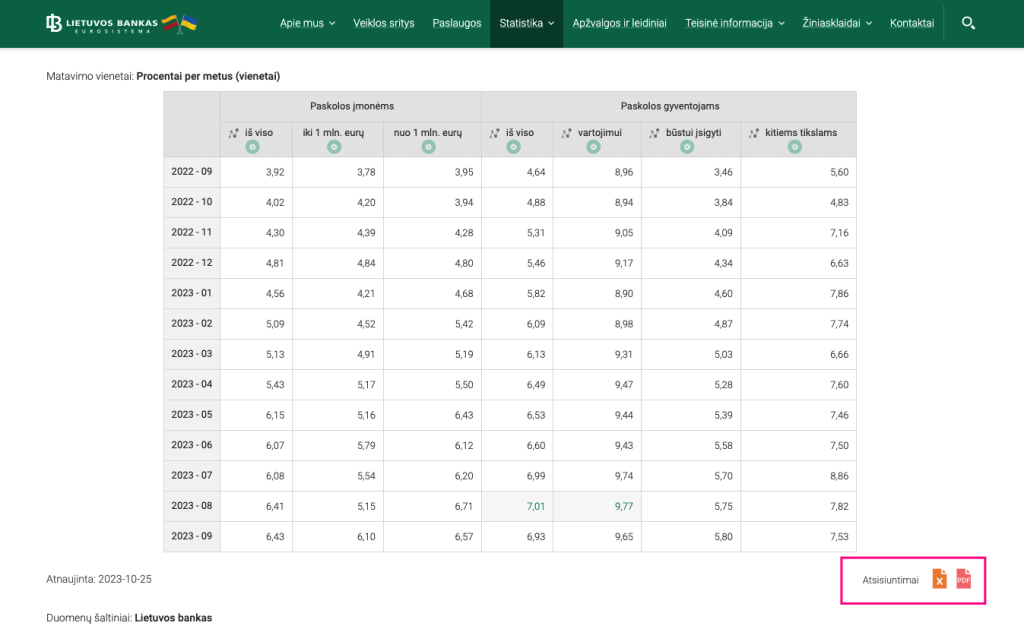
The best strategy to fetch data is to use Python pandas library, as it has quite advanced XLS reading capabilities. Here is example how to read structured data for this example:
import requests
import json
import pandas as pd
from pprint import pprint

excel_url = "https://www.lb.lt/lt/m_statistika/t-paskolu-palukanu-normos/?export=xlsx"
df = pd.read_excel(excel_url)

selected_data = df.iloc[12:, [0, 6]]

selected_data.columns = ['date', 'value']
json_data = selected_data.to_dict(orient='records')

results = [{
  'date': row.get('date').replace(' ', '') + '-01',
  'value': row.get('value'),
} for row in json_data]

print(json.dumps(results, indent=2)) Sharing charts
Sometimes we want to visualise data, in the form of infographic or chart/dashboard. For example, this is interactive chart depicting salaries growth rate:
This could be used in media articles as well to back content with (live) data.
Infogram tool
We use infogram tool for data visualisation as it allows to share charts easily and have quite big collection of charts available.
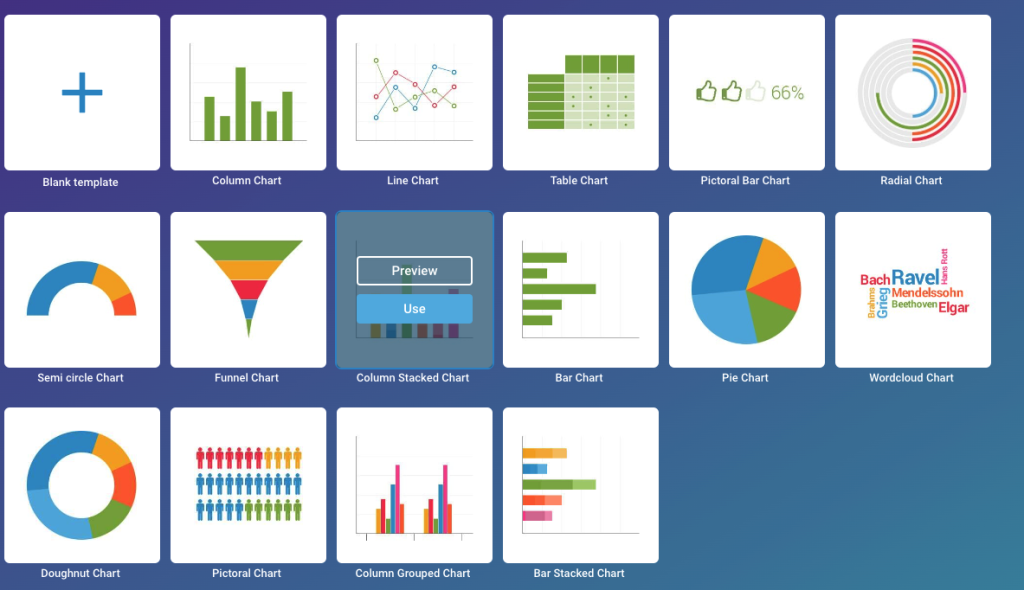
Example: line chart
We will use example above (charts) to demonstrate how to build interactive chart.
Lets build static chart first. Pick line chart, and add data manually:
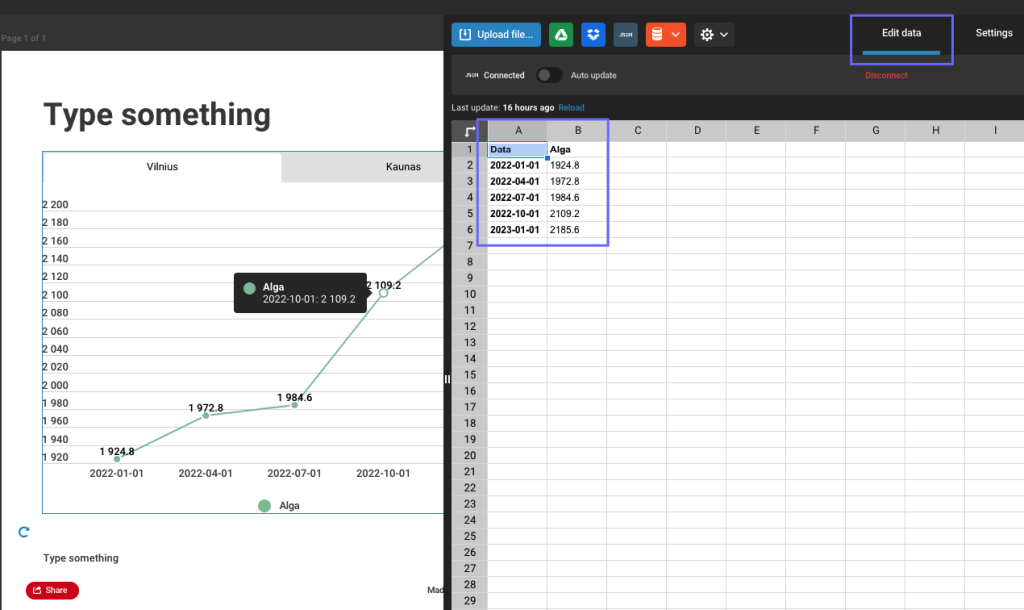
To keep it interactive you will need to use JSON feeds option.
Important: works for static snapshot, for live updates (i.e. update real time) it requires paid version of app.
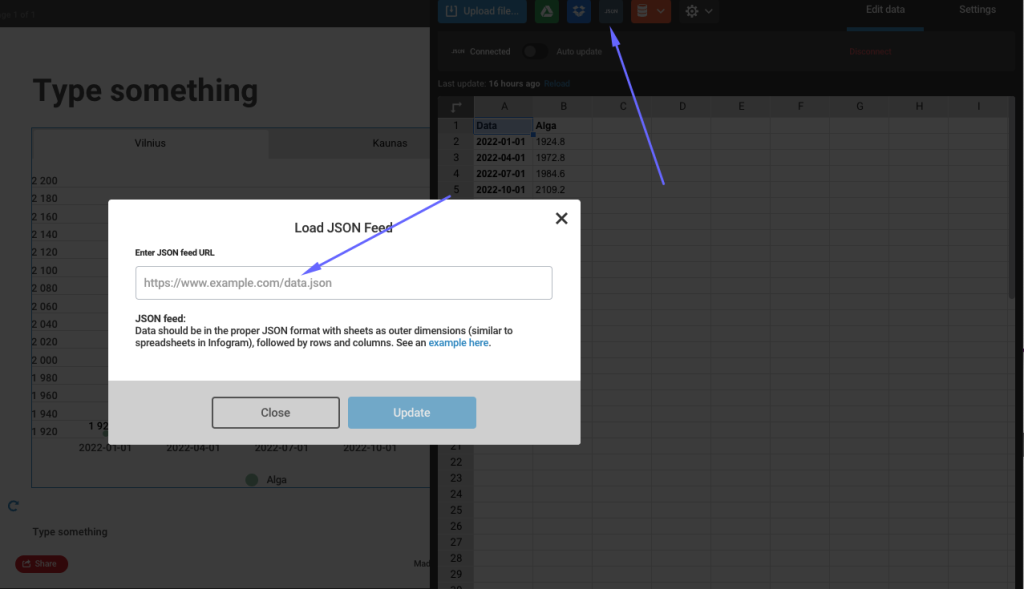
Data should be in the proper JSON format with sheets as outer dimensions (similar to spreadsheets in Infogram), followed by rows and columns.
[[["Index of Happiness","09:00","10:00","11:00","12:00","13:00"],["Eden",794,404,301,563,406],["Shambhala",470,940,142,575,294],["Avalon",332,914,860,616,741],["Camelot",351,686,720,447,467],["El Dorado",863,353,612,872,533],["Atlantis",382,882,240,320,420]]]Here is the API link which returns JUST data, without other meta information (snapshot created date, etc). You will have to use this in Infogram tool when prompted “Enter JSON feed URL” (replace challenge with your ID):
https://api.dataplatform.lt/snapshots/latest/json/?challenge_id=459You can inspect results here. Here is example which would produce data in required format in data platform
import requests
import json


def get_last_snapshot(challenge_id):
  api_url = 'https://data-platform-backend-4ddpl.ondigitalocean.app/snapshots/latest/?challenge_id=%d' % challenge_id
  response = requests.get(api_url)
  data = response.json()
  return data.get('json_data', [])

payroll_data = get_last_snapshot(237)

location = 'Vilnius'
payroll_data = list(filter(lambda p: p.get('location') == location and p.get('salary') == 'Bruto' and p.get('company_status') == 'With', payroll_data))
payroll_data.sort(key=lambda d: d.get('date'))

results = []
results.append(['Data', 'Alga'])
for item in payroll_data:
  results.append([item.get('date'), item.get('value')])

combined_results = [results]
print(json.dumps(combined_results))
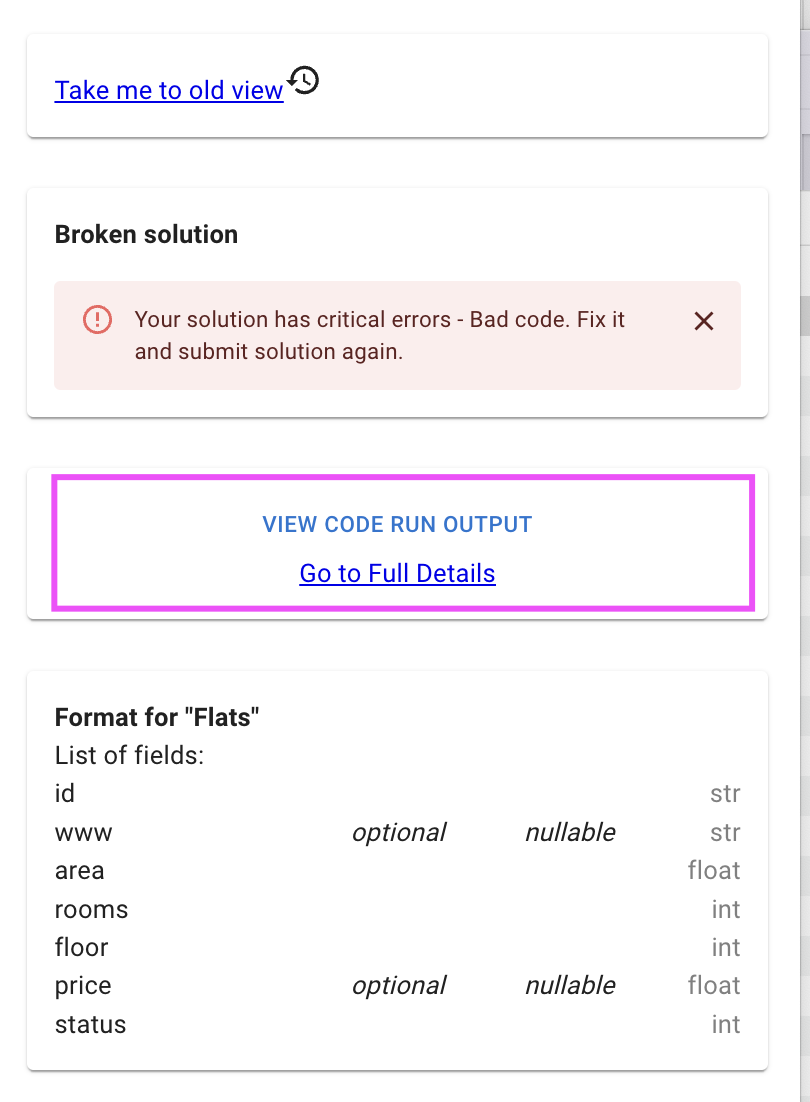
Debugging
Lost why your pipeline breaks? Add print statement (typically combining with existing program immediately, for example by throwing exception):
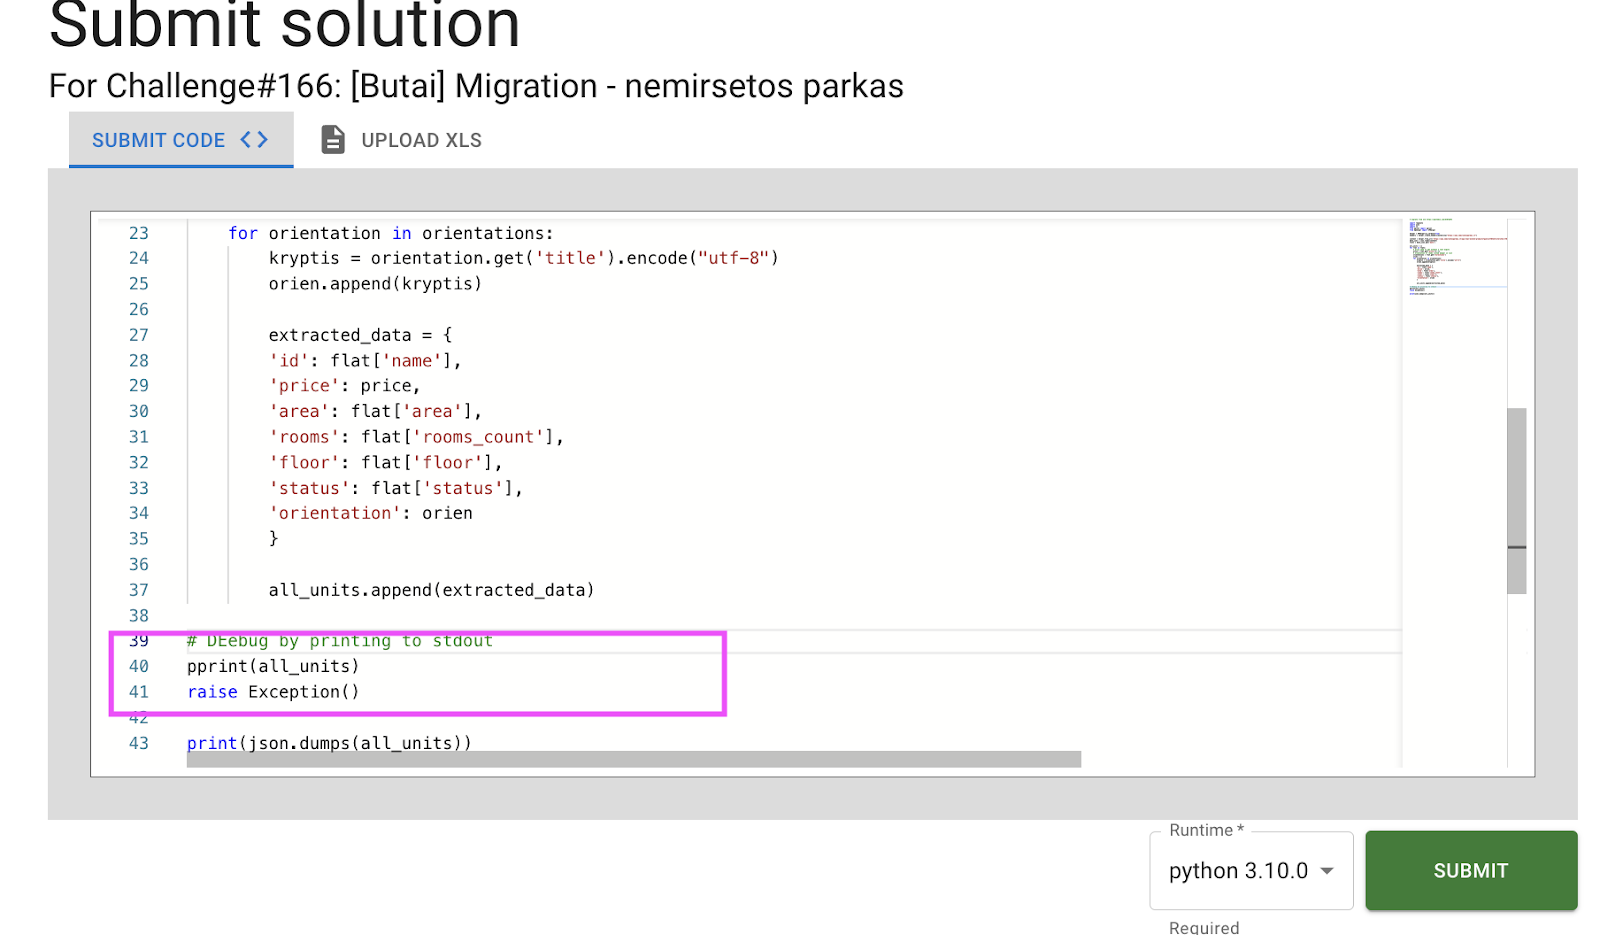 |
Now check intermediate print results shown in output
Another approach to debug is simply use stderr to print intermediate debug output. The pattern is as following:
import sys
print('This is an error message', file=sys.stderr)

# Output:
# This is an error message
Tip: data platform will only read sys.stdout as an output. You can use this as afeature: if you need to have some print statements (for example, statistics of each step in pipeline), you can route them to stderr.
Index and crawling pipelines
For use cases like listing portals, e-commerce (eshops), typical pattern is having very many pages in the system. Write one pipeline which crawls entire website and produces urls, while other populates data using those urls.
In a lot of cases even in indexing stage, you can find most of required information, so it would be faster. Furthermore, this will require less load on target website and decrease chance of being blocked.
Tip: please refer to section how to reuse data from another pipeline in our plaform.